Nordic ALCOHOL and DRUG policy network
NordAN

What and how much can we compare between countries? The DATA PROBLEM
.png)
March/April 2021
By Lauri Beekmann, NordAN
Alcohol per capita consumption level is the primary measurement used to measure the alcohol consumption differences between countries. Governments are interested in rating themselves compared to others, and scientists are using these figures to assess the effectiveness of different interventions and policy measures. The problem is that these comparisons have, very often, gathered data that is not comparable.
WHO uses the amount of pure alcohol consumed in litres per year per adult, defined as a person aged 15 or older. Estonia has emerged as a problematic country regarding this data and its use at the international level.
At least a couple of countries (Estonia, Finland) calculate the total consumption by that 15+ definition and also based on the whole population, from birth to death. As it is easy to understand, these figures would be very different and couldn't be compared in any form. But this is what has happened with Estonia. In 2014 WHO published a report with Country Profiles which claimed that the average consumption level in the period of 2008-2010 in Estonia was 10.3 litres. In reality, that number refers to that whole population figure.
15+ versus whole population
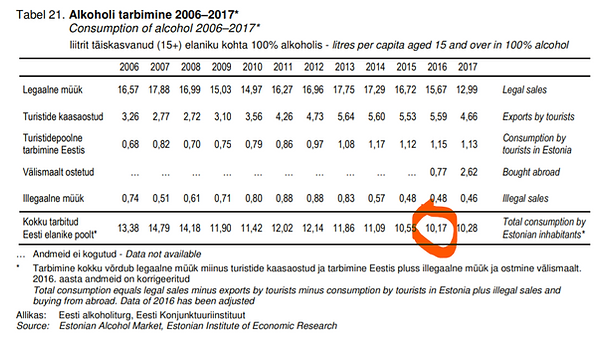
The 15+ consumption level was very different as shown in "Alcohol market, consumption and harms in Estonia" yearbook, also published in 2014 by The National Institute for Health Development and the Estonian Institute of Economic Research. The accurate consumption figures (15+) in 2008 was 14.18, in 2009, 11.90 and in 2010, 11.42 litres. In short - Estonian figures for whole population consumption data has ended up in 15+ comparison. The numbers look much better that way but, unfortunately, were far from reality.

Whole population consumption data

Litres per capita aged 15 and over

Global status report on alcohol and health 2018
The problems with Estonian data continued but changed in the 2018 Global status report on alcohol and health. In another country report, we find that alcohol consumption is quite a bit higher than the data that Estonia released itself. The global status report claimed that in 2016, the per capita consumption level (15+) was 11.6 litres. The national experts showed that in 2016 an average Estonian drank 10.17 litres. It is also interesting to note that in the 2018 report, the consumption data for 2010 has been corrected to 12.4 litres. So yes, fixed compared to the previous 2014 country report I referred to earlier, but the figure is still incorrect as in 2010, the consumption figure was 11.42. It is much higher than what the 2014 report claimed and much lower than what it is in the 2018 report.

Another massive problem for Estonia - growing spirits consumption?
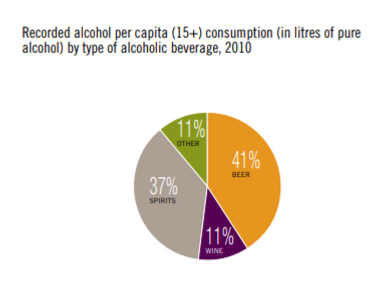
Let's stick around for a moment and explore one additional aspect of these WHO country profiles. It also publishes the share of different beverage types that make up this total per capita consumption level. Estonia has had traditionally a relatively high spirits consumption level, probably a legacy from the Soviet time. 2014 WHO country profile states that in 2010 the spirits share was 37%, which is one of the highest in the European region. For instance, in Finland, it was 24%, Sweden, only 15%. This situation is much closer to other Baltic neighbours, as in Latvia it was also 37% and in Lithuania 34%.
But when we look at that aspect in the 2018 country profile, something alarming appears to happened in Estonia as now (in 2016) 50% of alcohol is consumed in spirits. As it is expected in most other countries, we have seen a reduction in Finland (21%) and Sweden (14%) but also a slight increase in Latvia (40%) and Lithuania (37%). But the situation in Estonia seems to be unprecedented.
But again, this information is not supported by the national data in Estonia. The Alcohol Yearbook 2017 shows that in 2010 9.38 litres per capita was consumed in strong alcoholic beverages, which dropped to 7.96 in 2016. We do have to remember that the overall consumption level also dropped, so the decrease in percentage wasn't that big. Still, there are no grounds to believe a massive increase in spirits consumption in Estonia.


How this data is used by journalists and scientists?
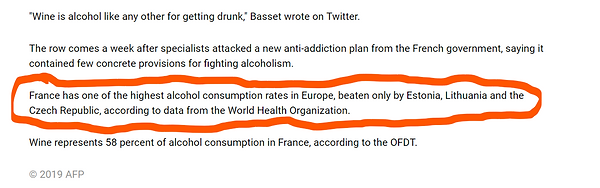
As we can understand, this is where both scientists and journalists are getting their basic information. The result is a rather disturbing coverage by the media, and one can only imagine what it means for the scientific conclusions if the starting point is flawed. Here is an example from France 24 news article from January 2019, which deals with French alcohol policy. As a side note, it also states: "France has one of the highest alcohol consumption rates in Europe, beaten only by Estonia, Lithuania and the Czech Republic, according to data from the World Health Organization." That is just one example of how the WHO data is used to repeat that Estonia has one of the highest per capita consumptions in Europe.
It is only logical that scientists turn to WHO/OECD data to compare European countries. One cannot expect that the scientist would double-check all these individual country figures. But the result is unfortunately distorted and not accurate. We can see this in a comparison compiled by Colin Angus from the Sheffield Alcohol Research Group of The University of Sheffield. From this GIF graph, it can be seen that "based on the WHO GISAH database", Estonia takes over the consumption leader position in 2005 and holds it until the end - of 2015. According to GISAH interpretation, Estonians drank 16.6 litres in 2015, but it was only 10.55 litres (after excluding exports and consumption by tourists) according to national data. With that drinking level, Estonia would have barely fit into that comparison, sharing the last place with Portugal.

A quantitative study conclusions into the effectiveness of alcohol policies in European countries
In January 2021, a quantitative study into the effectiveness of alcohol policies in European countries was published by the master students from the Vienna University of Economics and Business. The study aimed to "investigate the effectiveness of the selected alcohol-related policy responses in Europe within the 2009-2016 time period." One of this study's conclusions was that the results do not confirm that the considered alcohol policy responses are ineffective. Still, they do reject the supposition that they are generally effective.
Estonia received some special attention as it appeared to stand out because of its persisting high consumption, regardless of new alcohol policy measures that the government had introduced. The study found: "On the other side of the spectrum, in some countries with more policies in place, such as Estonia or Lithuania, high per capita alcohol consumption persists, which may potentially indicate high ineffectiveness of the policies in place. Yet, considering that our study covers a relatively short-time span, an alternative explanation in which the implemented policies are still effective (in these countries specifically) in lowering consumption levels that would otherwise remain considerably higher, is also possible. Since heavy drinking patterns in these countries are believed to be a result of e.g., historical conditioning (see e.g., Jargin, 2009), the implementation of numerous control policies is most probably a consequence of heavy drinking patterns, rather than the cause of high alcohol consumption levels. For instance, Estonia is characterized by a high share of excessive drinkers and consuming predominantly high-percentage beverages (WHO, 2018)."
These conclusions are an excellent example of what happens when researchers are comparing the wrong data. To remind again, according to national statistics, Estonia went from 14.18 litres per capita in 2008 to 10.17 litres in 2016. With these numbers, it would be impossible to conclude that "high per capita alcohol consumption persists", as the study found. Having 2018 WHO data in front of them, it is also understandable that the authors got stuck with understanding that Estonians are "consuming predominantly high-percentage beverages". Researchers were in a position where they had to work with data that does not reflect Estonia's actual situation and developments.
The untrustworthiness of the national data is always a possibility. And with several countries in the European region, this is probably very much the case, making these comparisons a real problem. But what about Estonia?
To solve that problem, I use an article published in the WHO Journal Public Health Panorama. Article "Improving monitoring of implementation of alcohol policy: a case study from Estonia" was published in September 2018. It states: "In 2016, Estonians drank five litres less alcohol per adult annually than in 2007. The reduction in consumption has also led to a reduction in problems associated with alcohol consumption. The number of deaths from alcohol-related illnesses has fallen by 40%, meaning that measures to reduce alcohol consumption may have saved as many as 300 lives per year since 2007."
Estonia has seen the most considerable reduction in per capita consumption from 2008-2018 in European Union and has moved from the top to the middle of that comparison list.

National data can't be trusted?
Next issue: recorded and unrecorded consumption
OECD's Health at a Glance report, published in 2019, is another source for per capita consumption comparison between countries. In 2017, Estonia was reported to have 10.3 litres and Finland 8.4. This time, the Estonian number is correct and follows the national data, but the Finnish number cannot be accurate in this comparison. After consulting with THL experts in Finland, it became clear that the OECD report is based on recorded data (sales). And according to the Finnish national data, the recorded consumption in Finland was 8.4 in 2017. So that's correct. But that is not the total consumption figure. For that, we should add another 2 litres, as this is the unrecorded consumption in Finland in 2017. We could perhaps settle this problem by accepting that the OECD focuses on sales data rather than consumption data. But Estonian figure 10.3 is precisely that - total consumption, both illegal market and the part that Estonians bought from Latvia, is included (also illegally imported and self-manufactured). The report compares Finland, where it doesn't add the part that Finns are purchasing from Estonia, with Estonia, where they add the part that Estonians buy from Latvia. As it turns out, Estonia is again the odd one on the list.
Another problem is that as it excludes that cross-border trade part between Estonia and Finland, which is 5.59 litres (per adult Estonian, which makes around 2 litres per adult Finn), where does that alcohol amount ends up? The chapter title is "Alcohol consumption", and someone definitely consumed that amount, but it's not shown in these figures. Not included in Estonian number, nor the Finnish number.
The problem of cross-border trade is dismissed here. But that links countries very tightly to each other. And if something is miscalculated in one country, it affects others. Another example - as the 2.6 litres that Estonians bought from Latvia is included in the Estonian figure, but as this report is measuring legal sales (as we saw from Finnish figure), then is that same amount also included in Latvian figures as this is part of their sales data? If this is so, we have a relatively significant amount of alcohol that two people, one Estonian and one Latvian, seem to be drunk.

Consumption or sales data?
As it came out from OECD report, often only recorded consumption is counted. That is how much alcohol is sold through official channels. If recorded or registered alcohol is presented as something that shows how much a particular nation drinks alcohol, this is only a part of the picture. And for various reasons, a distorted view. Data collection that is focused on alcohol and health as reports like "Health at a Glance" or "Global status report on alcohol and health" seems to be, should definitely aim for total consumption and not only sales.
First of all, cross-border trade makes it impossible to argue that sales data would be enough to make any conclusions regarding alcohol and health. In 2016, Estonia's legal sales were as high as 15.67 litres, but that number didn't affect the health of Estonians as 5.59 litres from that was exported by tourists, mainly by Finns. Another 1.15 litres was indeed consumed in Estonia but again by tourists, so we should exclude that as well. In 2016 we added 0.77 litres because that was bought by Estonians from abroad, mainly from Latvia. And the total consumption, which then could only affect the Estonians health, was 10.17 litres. The sales data is a piece of economical information and always needs further explaining.
Disregarding cross-border trade would mean that you add litres of alcohol, that they didn't drink, to Estonians' consumption. And from the other side, you would miss the litres from Finland, while analysing Finns' consumption only based on the sales data that Finns bought from their own country. Conclusions would be wrong on both sides - Finns appear to drink less with higher harm, and Estonians seem to have lower harm with much higher consumption. In whose interest would that be?
In addition to cross-border trade, there is also rather significant illegal sales in some countries that should be added to get the to total consumption. Illegal sales refer to either illegally imported alcohol or illegal self-manufactured spirits. For instance, in Estonia, in 2017, a total of ca 1.3 million litres of illicit alcohol was consumed, which accounted for 20-23% of the vodka consumed by residents.
popNAD: It is not enough to compare sales data
Malin Wikström wrote in popNAD in August 2020 that the official cooperation compiling joint statistics between Nordic countries is finished, and the only recourse for anyone wishing to compare alcohol consumption in the various Nordic countries is sales figures.
"Sales statistics are available from all Nordic countries and, in principle, these can be compared − with the major caveat that we are not dealing with total consumption figures but rather sales in each country. If we look solely at consumption figures, then comparable figures between Finland and Sweden go a fairly long way back," Thomas Karlsson, Chief Specialist at the Finnish Institute for Health and Welfare (THL), told popNAD.
"There is no significant political interest in monitoring the scale of unregistered alcohol imports into Norway and where this is done it is solely a matter of studying the phenomenon in and of itself. In Finland and Sweden, however, there are large economic and political incentives to keep track of and study the extent of private alcohol imports," Karlsson explained.
“Denmark has completely halted the publication of statistics on total consumption. This is largely due to the lack of figures on which to base an estimate of imports, especially when it comes to alcohol transported across the border from Germany. One might say that there is a lack of political interest in the issue in Denmark and perhaps a lack of interest in financing research into alcohol,” says Thomas Karlsson.
Professor Kim Bloomfield of the Centre for Alcohol and Drug Research (CRF) at Aarhus University in Denmark: “I think it would be extremely interesting and a great help if we could obtain comparable alcohol statistics from all Nordic countries. It is a real shame that there is no interest and funding for this at a national level. In the other Nordic countries in particular, it is not enough to compare sales data, given that any accurate estimation of how much people drink is dependent on a figure for total consumption.”


Thomas Karlsson
Kim Bloomfield
How Estonia comes up with per capita consumption figure?
Different countries use different methods to calculate the per capita consumption. As we have already seen, these final figures include different information. How does Estonia measure the average amount of alcohol consumed by an Estonian? The following information comes from the Estonian Institute of Economic Research (KI), which collects annual per capita consumption data.
According to KI, the 15+ Estonian drank 10.17 litres of 100% alcohol in 2016.
LEGAL SALES. The legal sales that year was 15.67 litres. Production + import - export. These are figures from official statistics and all these calculations are at a product level, i.e. vodka, cognac, cider, beer, etc.
EXPORTS BY TOURISTS. This is what makes Estonia rather unique. In 2016 it was 5.59 litres per capita. But cannot be included in the consumption data of Estonians as tourists took out this amount. KI calculates this figure based on:
-
The number of tourists that year.
-
Sales numbers of port alcohol stores and interviews with store employees.
-
Ship stores sales numbers.
-
Surveys of Finnish colleagues (THL), where they conduct regular population surveys on purchases abroad.
CONSUMPTION BY TOURISTS IN ESTONIA. 1.15 litres per capita. Again, not drunk by Estonians, so we have to remove that figure from legal sales as well. KI´s calculations are based on the number of tourists and on Ho/Re/CA sales and their estimate of the share of tourists in sales.
ILLEGAL SALES. There is also an illegal market for buying alcohol in our country, so we cannot rely only on legal sales. In 2016, it was 0,48 litres per capita. KI finds it by:
1. An annual population survey that examines both the respondent's own purchases on the black market and an assessment of neighbours as a general knowledge of whether and where to buy. Respondents: adults, sample at least 1000.
2. Expert assessment of producers and stores on the black market.
3. Tax and Customs Board and police information on confiscated illegal goods.
BOUGHT ABROAD. Estonians are also buying from abroad. 0.77 litres in 2016. KI has been adding these figures since that year as a sharp increase in excise tax in Estonia caused cross-border trade from Estonia to Latvia to grow. KI finds it by using:
-
An annual survey of residents asking if they bought alcohol from abroad. Did you go shopping or transit, etc. Respondents: adults, sample at least 1000.
-
Data from the Latvian Tax Administration.
-
Data on sales of Latvian border shops.
-
Sales of Estonian producers to border shops.
-
Tax and Customs Board´s data on short-term border crossings.
Total consumption equals legal sales minus exports by tourists minus consumption by tourists in Estonia plus illegal sales and buying from abroad.